This particular object I began looking more into right around the time I was also preparing for the written qualification exams at Clemson University. PHEW that is a stressful time to look back on. Maybe I’ll write more about the PhD process in the program in another blog post but, for now, let’s focus on the second Fermi object I investigated. I had a task to gather data for 12 newly detected very high energy sources – or VHE, which we will define at an energy E > 50 GeV which is among the highest energy for light, the gamma-ray range. The gamma-ray space telescope, Fermi, had just discovered these sources and were reported in 2016 (free and public pdf version available here). I was looking at multiple sources at once but, one particular source, led me somewhat down a rabbit hole and led to my second paper (in review but hopefully close to acceptance and publishing!) on the multi-wavelength analysis of the supernova remnant, G3447.1-0.1, which is found to be a likely origin for the newly discovered gamma-ray emission at the edge of the remnant. Does this sound familiar? It should! My first report was also on the discovery of gamma-ray emission on the edge of the Vela supernova remnant (SNR). Coincidence? Yes. Lol. Though this time the physics was a little more complicated but, all the more exciting!
First thing I noticed was this new gamma-ray source was pointing to the SNR G344.7-0.1, pictured below.
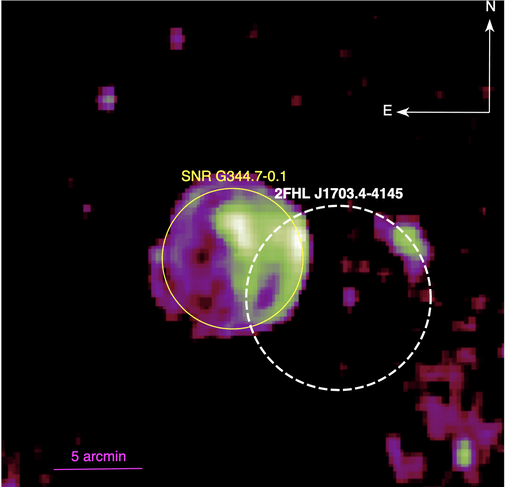
Radio (843MHz), the SNR is indicated and the 95% confidence region of the gamma-ray source is the white dashed circle.
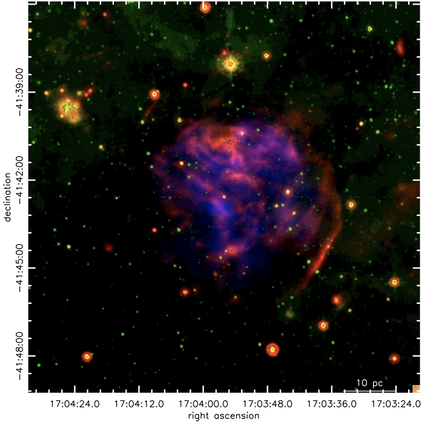
The SNR as seen in 3 different wavelengths of light. In blue is soft X-ray emission (soft meaning low energy), and red and green represents 24 and 8 um infrared emission.
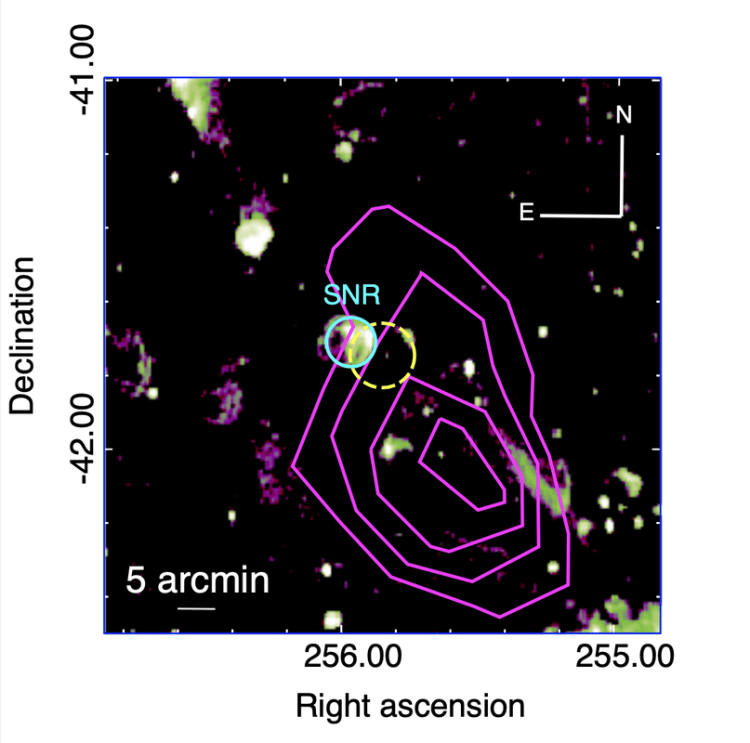
The same X-ray emission seen in the middle panel is shown in the color image here. The black lines are showing you the flux contours of the radio image from the left panel
Admittedly my only experience so far with gamma-ray objects was the emission we identified as a shock-cloud interaction on the west edge of the Vela SNR and, so far, I was looking at another SNR with gamma-ray emission appearing on the west edge which overlapped with bright radio emission and a strong infrared filament. The bright radio emission can be seen in the left panel above. The green color is showing you where the radio emission brightens which is seen to be on the north and western regions. Similarly, we see brighten infrared emission in the northern-central and western regions as shown in the middle panel. Do you see the red filament in the middle panel? This coincides with the gamma-ray position and bright radio emission. Interesting.
By the way, the above images can be found in the following reports: (left) Eagle et al., 2020 (arXiv pdf version here), (middle) Combi et al., 2010 (arXiv pdf version here), and (right) available here.
So what does this mean, exactly? Well, in general, where one might see increased emission accompanying high energy emission, like this gamma-ray source, points to some kind of interaction that would accelerate these particles to radiate at the varying wavelengths. Each wavelength provides us different information about the particles responsible for the radiation and how they must be interacting with their environment. This also means we can infer what that environment is made up of.
Recall my first report we were able to determine the presence of a small neutral hydrogen cloud that was found to coincide precisely with the western wall of the Vela SNR that paired with the observed gamma-ray emission there. We can plausibly describe the gamma-ray emission as arising between the remnant’s forward shock – that is, it’s outer layer that was blast into the interstellar medium first at the time of explosion – is running into its surroundings and is colliding with and disturbing the material.
Let’s break down my first findings:
There is bright radio emission to the west of the SNR G344.7-0.1 as can be seen in the left panel above. This may suggest the remnant is interacting with its surroundings, much like the scenario just described.
There is a bright infrared filament that outlines the west wall of the remnant, overlapping with the bright radio emission seen and also coincides with the X-ray boundary of the SNR (we will see in the next post that the radio emission mostly follows the filled X-ray center appearance of the SNR).
The infrared emission suggests the remnant has recently swept up dust and shocked it that then radiated in the infrared regime.
At this point in time, I was leaning towards thinking it was another shock-cloud interaction. In my defense, the pieces seemed to be falling in a way that a shock-cloud interaction made sense but, also keeping in mind, it was my only exposure so far. I needed to keep an open mind.
I still had questions. If it were a shock-cloud interaction, then where is the cloud? Can I prove the presence of one? We knew at the time the SNR was in a dense environment in this part of the Galaxy based on its appearance across the light spectrum and by measurements of the surrounding densities but, the SNR’s distance was too uncertain to reliably pinpoint the existence of gas clouds in the same region of this remnant.
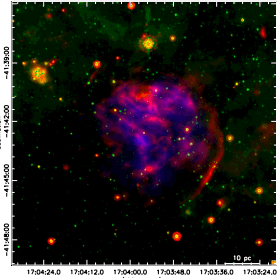
Above in red is the radio emission together in green with the infrared emission. The filament on the west traces the radio emission that fills the SNR entirely, all overlapping with the position of the gamma-ray source.
Furthermore, there is even higher energy gamma-ray emission found to the southwest of the remnant, in the TeV range! It was first detected by HESS, a system of Imaging Atmospheric Cherenkov gamma-ray telescopes that operate on the ground. HESS stands for the High Energy Stereoscopic System and more information on it can be found here. There were no other sources that were found to be in the same location as the HESS emission found at that time (which extends over a decent amount of space, it’s not just a point source). They labeled the HESS source as “dark” because they could not identify its origin due to the lack of information at other wavelengths. But now, we have a lead!
Remember these? It is a spectral energy distribution plot. The data points are the purple stars and green squares. The best fit models with uncertainties are the purple and green shaded regions. This was first reported in the Fermi 3FHL catalog (Ajello et al., 2017).
Overlaid the TeV emission contours over the radio emission map with the SNR and 2FHL positions indicated. The TeV emission extends over a large region!
It was suspected before that the HESS TeV emission and gamma-ray emission from Fermi were coming from the same source. We plotted their flux data on the same plot and saw the data flowed well together, and could plausibly be from the same emission mechanism (above, left panel). The right panel shows the extent the HESS source has. It was unclear at the time what was unfolding here. If the TeV emission is connected to the supernova remnant, and the remnant is gamma-ray emitting on the western edge, how does it all fit together? What is going on?


Pingback: A DISTANT, COMPLEX SUPERNOVA REMNANT G344.7-0.1 – JORDAN L. EAGLE